May 18, 2016
How to Calculate Marketing ROI
“Can you tell me exactly how to calculate my marketing ROI?” You have no idea how many times I’ve heard that question. In this post, I’ll do my best to provide a simple step-by-step guide, but there isn’t a perfect solution for everyone. However, there are some core concepts and a basic process you can follow to start you on your ROI journey. But before diving right into the ROI equation, there are a few things you need to do to ensure an insightful analysis.
Decide the questions you need answered
It might seem trivial, but prior to even touching a spreadsheet, you need to outline what you’d like to measure. ROI is all about figuring out what is (and is not) working, and getting insight into where to reallocate resources. Do you want to view ROI by marketing channel? Campaign? Sales team? All of the above (and more)? Write down all of the different filters you’ll need in order to pivot the dataset to your needs. This step is vital, and will save you headaches later on. Knowing exactly what you want answered will help you (or your analyst) design your dataset to answer your questions from the get go, rather than having to modify and re-pull data for new asks every other day. Good analysis always raises new questions, and by defining your core objectives up front, your team will have more time to focus on insights. Let’s say a marketer, we’ll call him Dave throughout this post, works at a B2B company. Dave has two main objectives:
- He needs to justify his marketing budget to his CMO, and
- He needs to decide where to allocate investments across his marketing mix
Not only does he want to calculate his overall ROI, but Dave also wants to see ROI by marketing channel. Since he knows in order to accomplish this he’ll need channel level data, Dave adds that level of granularity to his initial dataset. Which brings us to metrics.
Align your metrics and dataset structure with your objectives
As marketers, we tend to think in clicks, leads, CPA, CPC, etc. While those metrics are great for campaign management, it’s time to put on your finance hat and think like a CFO. You’ll need to dive into your lower funnel and financial metrics. I’m talking gross & net revenue, customer acquisition cost (CAC), churn rates, average revenue per account/user (ARPA/ARPU) and lifetime value (LTV). While a spike in lead numbers may get our juices flowing, these are the business metrics that matter to your CMO, CFO and executives. To complete his ROI analysis, Dave needs to have two reports: The first report should have a unique row for each marketing touchpoint for all new customers within the period being analyzed. This means that a customer can appear multiple times within the report – one row for every time they interacted with marketing. Each row within the report should contain the following columns:
- Date of the marketing touchpoint
- The marketing channel for the touchpoint
- A unique identifier of the customer that performed the action
- When the customer started spending
- How much the customer has spent (aka revenue)
- If they are still spending at the time of the report
- Any additional customer information you’d like to include in your analysis (e.g. customer groupings, customer stage, customer industry/vertical, etc.)
Getting all of these metrics in one report often requires some work. We won’t go into specifics, but usually you can find these metrics in your backend database or CRM using a SQL or R query. Luckily for our marketer Dave, his analyst was able to pull together the report in no time: 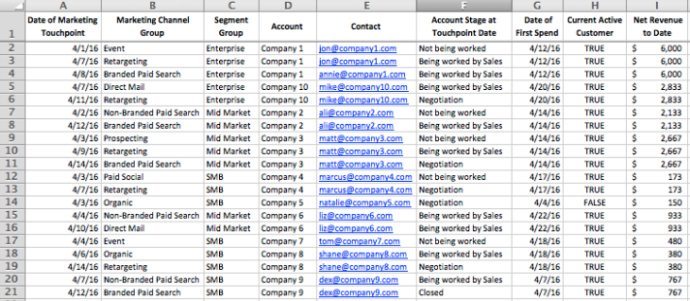 Dave’s report pulled all of the marketing touchpoints on a group of new customers in April. In this example, there are 10 new spending companies in the period, with 20 touchpoints between them. Notice Dave included Marketing Channel (column B) in his report, as this is necessary to answer his marketing mix questions and figure out which channels are (or aren’t) driving business growth. Furthermore, Dave also included columns for “Account” (column D, which serves as his unique customer identifier) and “Account Stage at Touchpoint” for marketing-sales attribution (column F, more on that later). For his second report, Dave also wants his cost data to align with his objectives. Since he is looking at his marketing mix, Dave has broken down his cost data by channel in a separate tab:
 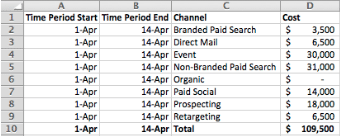 Lastly, Dave decides his key performance indicator (KPI) will be a 12-month ROI metric (aka how much revenue he can expect after a year). Since Dave only has a portion of revenue data, he’s going to need to project 12-month revenue numbers. In reality, you would calculate your projections based on your ARPA growth and churn cohorts – you can get these from your finance team. To maintain the simplicity of the example, I’ve added a column to Dave’s dataset called “12 mo. Net Revenue Projection” using some nice, round numbers.
 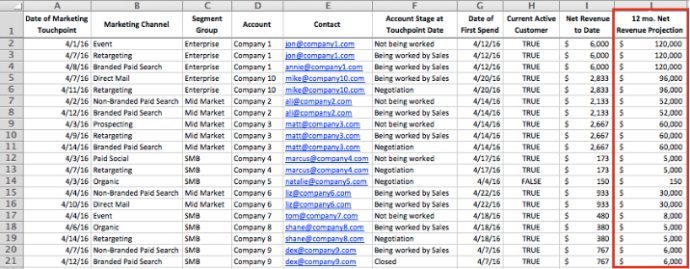 Now that Dave has all the data he needs, it’s time to talk about a little topic called attribution.
Attribution
I think about attribution as three (almost) separate topics: attribution windows, media touchpoint attribution, and sales-marketing attribution.
Revenue attribution windows
A revenue attribution window is the amount of time prior to the account/users first spend date in which a touchpoint can influence the buying decision. Only touchpoints within the defined attribution window should receive any revenue credit, and your window should line up with your sales policy or customer’s buying cycle. In our example, Dave will be using a 30-day attribution window. This means that in order to receive credit for revenue, the marketing touch will have had to occur no more than 30 days prior to the accounts first date of spend. Check out Row 21. Notice that the touchpoint occurred after the customer had already started spending. Since this interaction had no influence on the customer’s decision to purchase, this row should be excluded from the dataset. 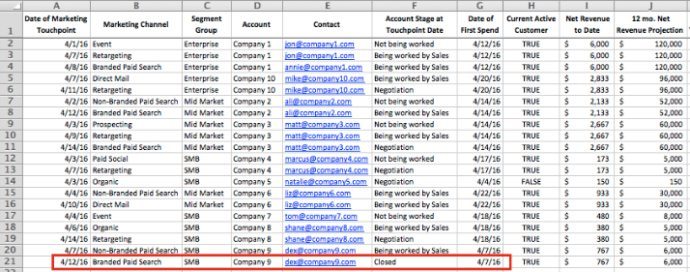
Media touchpoint attribution
This is typically what comes to mind when marketers talk about attribution. How do you divide revenue across your marketing touchpoints? There are several schools of thought, but here’s a quick breakdown of some of the most popular attribution models:
- First touch - 100% of revenue is allocated to the first marketing touchpoint in the attribution window.
- Last touch - 100% of revenue is allocated to the last marketing touchpoint in the attribution window.
- Linear - Revenue is allocated evenly across all marketing touchpoints in the attribution window.
- Time decay - Revenue is allocated across all marketing touchpoints in the attribution window, with the last touchpoint receiving the most credit, and each prior touchpoint receiving less credit based on how far from the first spend date it is. For example, an account with four touchpoints could have a revenue allocation of 1st Touchpoint = 5, 2nd Touchpoint = 10%, 3rd Touchpoint = 35%, 4th Touchpoint = 50%
- Position based - Revenue is allocated across all marketing touchpoints in the attribution window based on their position. For example, an account with four touchpoints could have a w-shaped revenue allocation of 1st Touchpoint = 40%, 2nd Touchpoint = 10%, 3rd Touchpoint = 10%, 4th Touchpoint = 40%
There’s plenty of discussion on different attribution models (we even wrote a whole whitepaper on it), but I’d strongly suggest using a multi-touch model to capture a fuller picture of an account’s customer lifecycle. In our example, Dave will be using the linear model. In our handy-dandy spreadsheet, Dave used a simple COUNTIF function (COUNTIF(D$2:D$20, D#) to count the number of touches per account, and he then divided the revenue projection by that number. 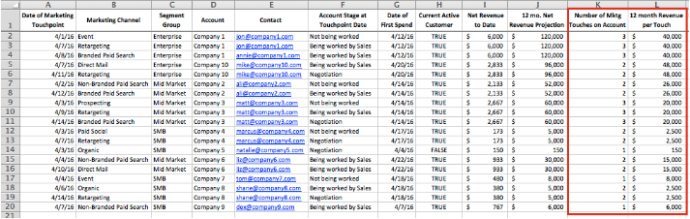 Conversations about view-through conversions often arise at this point in this discussion. I won’t go into them now, but if you’d like more info, there are plenty of good resources on the AdRoll Help Center and AdRoll Blog.
Sales-marketing attribution
For more complex ROI models that address the full acquisition funnel, you’ll want to include sales touchpoints and costs as well. This requires you to allocate revenue between sales and marketing orgs. Typically this is done by allocating a percentage to both orgs based on the stage of the account at the time of the marketing response. The actual percentages are up to you to decide! For example, if an account was not previously being worked by sales when it responded to a campaign, marketing would receive more revenue credit – say 75%. But if an account was already in negotiations when they interacted with marketing, then the marketing org would get much less revenue credit, maybe closer to 15%. If the account closed without any sales touch, marketing would receive 100% credit. Your actual percentages are up to you to decide (in conjunction with your sales management). Dave and his sales management team agreed on some allocation percentages, and used them to calculate his 12 mo. Marketing Revenue Allocation – what he’ll actually be using for ROI calculations. 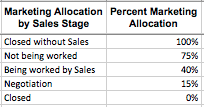 Build the sales-marketing attribution into your model by multiplying your revenue by your marketing allocation percentage (use an IF function to apply the right percent based on stage). For example, in row 12, Company 4 was not being worked, so marketing received 75% of revenue credit from the touchpoint. However, in row 13, Company 4 was now in Negotiation, so Dave only counts 15% of the touchpoint’s revenue credit towards marketing.
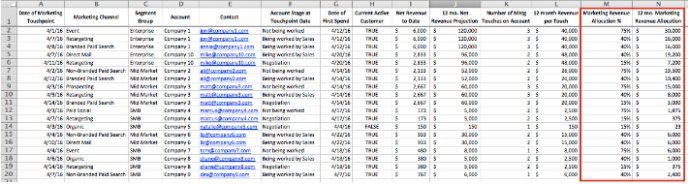
Time to put all this mumbo-jumbo into action
Now that all the hard work is done, getting to your ROI is as easy as pie. Start by creating a pivot table with your dataset to get your revenue numbers. Be sure to use a SUM of the correct revenue field, and pivot on the fields you want to slice by. For our example, Dave uses a SUM of the “12 mo. Marketing Revenue Allocation” column, and sets “Marketing Channel Groups” as his rows, so he can see revenue by channel. 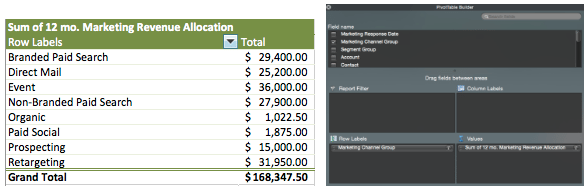 Now just divide by your costs and voilà – overall Marketing ROI and ROI by channel!
 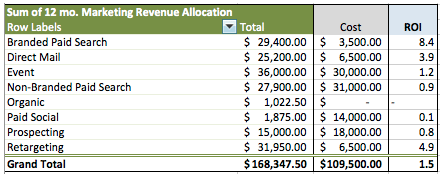 Now you have data to answer your burning questions. Dave can now tell his CMO that for every $1 in his budget, he can turn it into $1.50 after 12 months. That’s some pretty compelling data to justify your marketing budget, Dave. On top of that, Dave can look and see which areas of his mix warrant additional resources, and which he should re-evaluate. In our example, Dave probably wants to take some budget away from paid social, and push more towards retargeting or direct mail programs. Hopefully, both you (and Dave) now have a solid basis for understanding marketing ROI. It’s important to remember that this is only the beginning of your ROI journey. The complexities and adaptations you can make to your model are endless, but hopefully this advice helps you start having some data-driven conversations. Do you have any follow up questions about measuring marketing ROI? Anything you’d like me to elaborate on? Let us know in the comments.